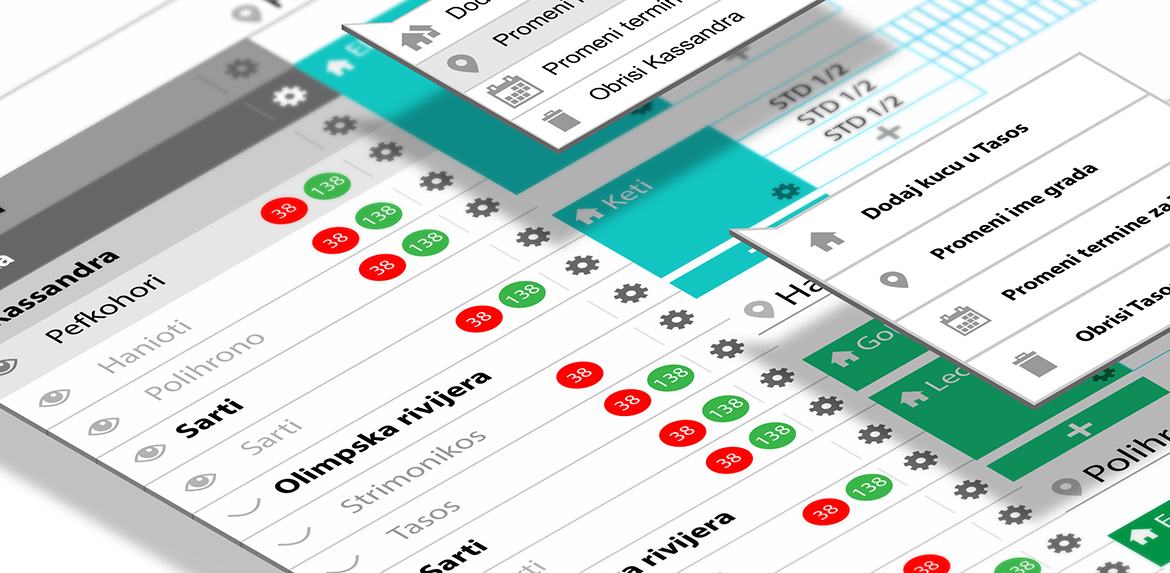
Chart – “dashboard”
Easy Travel Manager is the only software for tourist agencies currently offering chart view of the capacity availability in real time organized by days, so called “Traffic light”. Traffic light offers table (traffic light) view of all available capacities to the travel agent which will allow him to design travel packages for potential clients. This service saves time and enables easy creation of partner packages, the service works for you.
During implementation of the dashboard one of the biggest challenges was to optimize the loading speed. Project is based on Kohana FW and on ORM and during implementation of dashboard previous team didn't have much time to consider bad sides of ORM during implementation.
Dashboard is the best solution for the user experience. Its mainly because user interface is similar to excel charts which agents did use in the past and also during dashboard design time (and even after), we got plenty of suggestions and tips from tourism experts on “how to make their life easier”.

Behind that “users paradise” (the “Traffic light”) stands very complicated back-end. Dashboard did use more then 80% of entities of the entire application (during the time I worked on project). So we worked with great amount of tables, nested entities (sometimes nested in more then 5 levels of nesting), multiple relationships between those tables, ...
If we have In mind all listed above we can conclude that the ORM is definitely not right solution for our problem. Even after DB index optimization ORM solution was shown as very slow especially with large amount of data ( the speed becomes linearly slower ). In general ORM is always slower and inefficient with complex queries – relationships but we also need to consider few more reasons. The best answers we can find here: http://ocramius.github.io/a-complex-orm-faster-than-sql/#/100, https://philsturgeon.uk/2011/06/15/misconceptions-about-orms/, http://www.slideshare.net/rob_knight/object-relational-mapping-in-php
The only solution for getting our dashboard data from database was to write raw sql queries with prepared statements and with temporary tables using group_concat functions.
Next step was to format those data and prepare them for rendering through loops. Formatting was done with storing data from queries to arrays and manipulating them using array functions.
Finally, we got to the point where our dashboard became 10 times faster than with previous version based on ORM.